Monday, August 30, 2010

Saturday, August 28, 2010

Friday, August 27, 2010
The BIG Move Is Still To Come!

In the above charts notice the following:
Interest rates and gold generally move in the same direction. We believe that rising interest rates are a Bullish and NOT a Bearish sign for Gold.
In many instances, interest rates tended to “peak” after gold has already peaked. This would not support the theory that rising rates end gold advances. If rising interest rates were ending the gold advances then one would expect interest rates to peak first and then cause gold to peak second.
FIND OUT MORE
Thursday, August 26, 2010
This is the third Bull Market since 1995.

All of them, including this one, have one thing is common ... what is it?
A quick look at the rectangle areas on today's Monthly S&P 500 chart gives you the answer. A level of 1103 on the S&P has been a pausing and consolidation area for each of the three Bull Markets.
The behavior of all 3 Bull markets has been for our red trend line to finally pull back and touch the blue trend line during a sideways consolidation.
This Bull market has been no different because the trend lines are once again merged. So, this model is saying that we are at that "old familiar place" once again.
This is an important, historic area. The real question at this level is now this: "Will the current Bull market now END and turn into a Bear market, or will it continue on and make new highs?"
This is a monthly chart, so each bar represents one month of time. Historically, the process at this juncture has taken three to five months to resolve. This one has been going on for a while, so we are looking at a matter of only a few weeks before we see how this 1103 juncture turns out.
- (By the way, for the curious ... the trend line settings are as follows: The shorter term, red trend line is a 6 month Weighted trend line. The longer term, blue trend line is a 12 month Simple trend line.)
http://www.stocktiming.com/Wednesday-DailyMarketUpdate.htm
Tuesday, August 24, 2010
2s10s Prepares To Breach Key 200bps Support, As Curve Flattening Resumes With Feeling
The main (and lately only) bullish indicator that everyone seems to be focused on (for all the wrong reasons), continues to telegraph ongoing distressed for the financial segment: the 2s10s part of the Treasury curve has tightened to 206 bps (this was nearly 290bps a few months ago). At today's rate of flight to safety it is possible the key psychological (whatever that means - computers need therapy if Fib levels are brached?) support level 200bps will be taken out. This means all the leading indicators will soon reorient downward yet again, which also includes the ECRI LEI, which is once again due for an inflection point.

And the recently far more critical from a funding standpoint, 2s10s30s butterfly, which we have discussed extensively as the primary carry driver of stock purchasing ability, has just gone double digit again.

There is no stopping the bubble juggernaut now
FIND OUT MORE

And the recently far more critical from a funding standpoint, 2s10s30s butterfly, which we have discussed extensively as the primary carry driver of stock purchasing ability, has just gone double digit again.

There is no stopping the bubble juggernaut now
FIND OUT MORE
Institutional Buying and Selling Trending
Institutional Buying and Selling Trending from stocktiming.

Close up chart of Long Term Trending Fed. Liquidity and Foreign Liquidity Inflows

FIND OUT MORE

Close up chart of Long Term Trending Fed. Liquidity and Foreign Liquidity Inflows

FIND OUT MORE
Monday, August 23, 2010

Sunday, August 22, 2010
We Get An Official Confirmed Hindenburg Omen On August 20th, 2010

We got a second official confirmed Hindenburg Omen observation Friday, August 20th, 2010 after getting a first observation Thursday, August 12th, 2010, meaning we are now on the clock watching for a stock market crash. There is a much higher than normal probability of a stock market crash starting sometime over the next four months.
FIND OUT MORE
Saturday, August 21, 2010
Cue The Panic
The Philadelphia Fed composite Business Activity index, expected to come in at +7, instead came in at -7.7 . The subindex for Number of Employees was the lowest since late last year; the Workweek index was the lowest since last summer. There is not much ambiguity here when you combine this with the Claims number. It isn’t looking great .

Now, note that the Philly Fed index is pretty volatile. So this is a good time to think in terms of rejectable hypotheses. Last month, I would have said the dip is concerning, but at the limit of what might be acceptable volatility for an economy still expanding. This dip, however, is sufficiently large that I believe we can dismiss the hypothesis that the economy is still growing as strongly as it was in Q1 and Q2 (when the government was stimulating the economy, that is). At -7.7, given the volatility of the series, we can’t be sure the economy is actually contracting, but at least in the Philadelphia region it is probably pretty close to zero.
FIND OUT MORE
Friday, August 20, 2010
Veritable Disaster
This was not a "weak report" this was a "veritable disaster".

Note that every component of the index except for prices paid is in contraction. This represents a massive squeeze on profits.
Also note the huge, widening spread between current conditions and future expectations. One of them is wrong and I suggest manufacturers are taking their clues from clueless economists who continually think things are going to get better.
FIND OUT MORE
Tuesday, August 17, 2010
Monday, August 16, 2010
Potash Sector Heating Up…Again


Fertilizers replenish the nutrients in our soil after harvest. These nutrients are mostly taken up by and removed with the harvested crop. These nutrients must be replaced, given back to the soil, in order to ensure next year’s crop. This replacement of nutrients is not an option, sure farmers might skip a year, even two, but…
“Failure to feed the fields is a trend that can’t last for long. While the global recession severely impacted fertilizer demand, the science of food production has not changed. The significant volumes of potash and phosphate that have been mined for crop production must be replaced to sustain the productivity of the soil.”
FIND OUT MORE
Sunday, August 15, 2010

Friday, August 13, 2010
Gap up opening before market open seen 3 AUG

I think somebody is preparing to short the market very hard just like 911 kind of short fall.
Dow-Gold Ratio

The DGR did however, show its hand when the upward recovery AKA bear flag AKA post-crash rebound known here as Hope '09 failed and broke down out of the channel. As with many other markets, the Dow is currently rising in relation to gold to test the breakdown. If DGR breaks up into the channel and breaks the resistive moving average, NFTRH will be forced to reconsider its stance. As yet however, no resolution and the current stance remains favored.
FIND OUT MORE
Tuesday, August 10, 2010
Five Major Lows on the Dollar Index at the 78-81 Level

This is a weekly chart of the US Dollar index going back 25 years. It is quite clear when looking at this chart that the 78-81 level in the US Dollar index is incredibly important. There have been five major lows created between 78-81 since 1990. I would expect to see an intermediate low created in this zone in the next few weeks.
FIND OUT MORE
Main Street
Many orthodox economic reports have been weakening and the Economic Cycle Research Institute (ECRI) publishes a Weekly Leading Indicator Index (WLI). This has nicely filled in the huge gap between announcements by the NBER.
The following chart shows a remarkable plunge to -10.7. Remarkable because anything below -10 says "Recession".

Baltic Index (BDI) broke down in early June. The plunge since has been severe and faster than the one in June 2008. We took that one as warning on the financial markets as well as upon business activity.

At such times, the BDI has been a reliable indicator on weakening international trade. While the equivalent in Europe to the ECRI is not yet being worried about, the Baltic links America's ECRI to the rest of the world.
Our case that the economy would decline virtually with the stock market seems to be working out. This means that financial history is still within a fairly typical post-bubble contraction that could run for a number of business cycles. Possibly each contraction would be severe and each expansion would be modest.
FIND OUT MORE
Monday, August 9, 2010
ENTER THE DRAGON
Not to be outdone, two days later, on July 21, China entered the fray. China's leading credit rating agency, Dagong Global Credit Rating Co., cut the USA's credit rating from AAA to AA. Of course this didn't even make it into the controlled mass media in the US but it is big news.
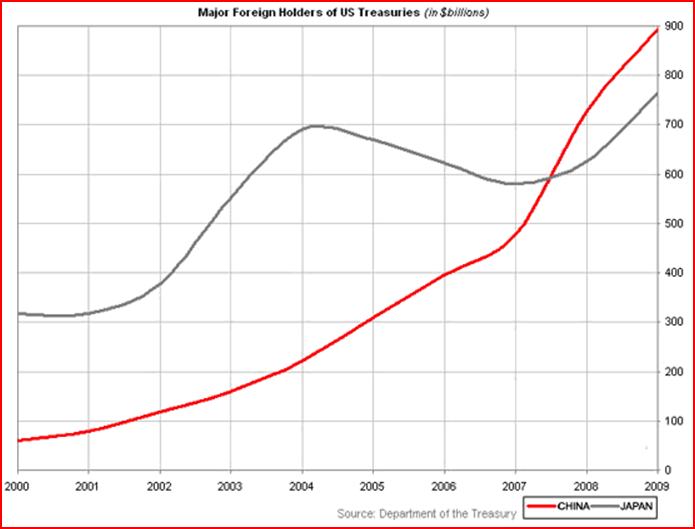
It's big news because China is the largest holder of US Government debt (see chart below).

China has increased its holding of US Government debt 900% since 2001! That is an average of 100% per year when based on 2001 levels. If there was a way to invest in a derivative of the increase in Chinese debt over the last 10 years this would have been the investment of the decade!
But it appears that China is finally putting on the brakes. In August of 2009 they owned $936.5 billion in US Government debt. The last reported figures, for May 2010, show that China "only" owned $867.7 billion. That's a 7% drop in the last 9 months. That's a mammoth change
FIND OUT MORE
It's big news because China is the largest holder of US Government debt (see chart below).
China has increased its holding of US Government debt 900% since 2001! That is an average of 100% per year when based on 2001 levels. If there was a way to invest in a derivative of the increase in Chinese debt over the last 10 years this would have been the investment of the decade!
But it appears that China is finally putting on the brakes. In August of 2009 they owned $936.5 billion in US Government debt. The last reported figures, for May 2010, show that China "only" owned $867.7 billion. That's a 7% drop in the last 9 months. That's a mammoth change
FIND OUT MORE

Sunday, August 8, 2010
Thursday, August 5, 2010
CRB Index bias on Coal & Iron ore

Source: http://www.rba.gov.au/statistics/frequency/commodity-prices.html
China's credit boom may have been supportive of base metals and iron ore prices. And if it goes, then the index of commodity prices published by the RBA this week (with a heavy bias to the contract prices of coal and iron ore) might look more like a "M" this time next year.
Wednesday, August 4, 2010


Monday, August 2, 2010


Sunday, August 1, 2010
Baltic Dry Index

If Baltic Dry Index continue to rally. We could see a rally in the market after 23 september.
Subscribe to:
Posts (Atom)